Using EDR telemetry for offensive research
About EDR
EDR – Endpoint Detection and Response – is a type of security solution, with agents running on endpoints (workstations, servers, etc.). Its first role is detection of incidents and threats. The second role is response, not only based on automatic prevention, but also giving Blue Teams the ability to perform various actions on endpoints, like downloading samples, dumping memory, or isolating the host from the network. EDRs have become a game changer in the cybersecurity landscape, with their origin dating back one decade ago. This article explores the notion of using EDR telemetry as a source of knowledge on software behaviors, and how to query that source to find potential security vulnerabilities.
Telemetry
To monitor systems for threats and malicious activities, EDRs collect relatively broad set of event information, commonly referred to as EDR telemetry. Those events include, but are not limited to, process creation (and termination), file creation/modification/removal, network connections, registry operations, various system events etc. In the rest of the article, I refer to them as base events. The exact list of supported base events, their names, properties, and information they provide varies between vendors. The telemetry from each endpoint is sent to a central location, where it is stored for a limited time (depending on our retention policy, e.g., 30 days). Base events can be manually searched through by EDR operators – usually for the purpose of investigating security incidents as well as for threat hunting. Base events are also used to build various detection rules.
The idea
As an occasional security researcher, I realized that EDR telemetry, especially from large infrastructures, can be very useful for learning about software behaviors and could be queried to catch behaviors indicating some potential vulnerabilities or abusable features.
Keep in mind – the telemetry not only differs among EDR solutions, but it can also change any moment for any given product. EDR products keep evolving and vendors from time to time introduce new base events and properties – so the trend is for the telemetry to get richer over time. Thus, I highly recommend fully examining the telemetry your EDR solution provides. And regularly checking it for changes, to see if any new base events or properties have been introduced.
The number of possible search scenarios is limited by our creativity and the telemetry our EDR provides.
I am sharing some of the scenarios I came up with, along with most interesting results so far. In my examples I give search criteria in a product-agnostic manner. Most searchers demonstrated here can be performed on any EDR telemetry. Some scenarios involve base events that not all products support at the time of writing (e.g. DLL loading). Eventually, how much you will find in your infrastructure depends on what events and properties are present in your EDR telemetry, as well as it will depend on what’s in your infrastructure.
Process creation
Let’s start with the most common and most important event – process creation. This event, regardless to the operating system, always has the following universal attributes:
- Command line
- Image path
- User ID
- PID (Process ID)
- PPID (Parent Process ID).
Most EDRs these days enrich the process creation base event with attributes such a parent/grandparent process information as well as the checksum of the executable responsible for process creation:
- Image hash (e.g. MD5, SHA256)
- Parent process command line
- Parent process image path.
Let’s start from using only these properties in our search criteria.
Process creation – command line
For starters, let’s focus on the first process creation property that comes to mind – the command line, and how we can use it to discover some cases of our interest.
LOLbins/GTFObins
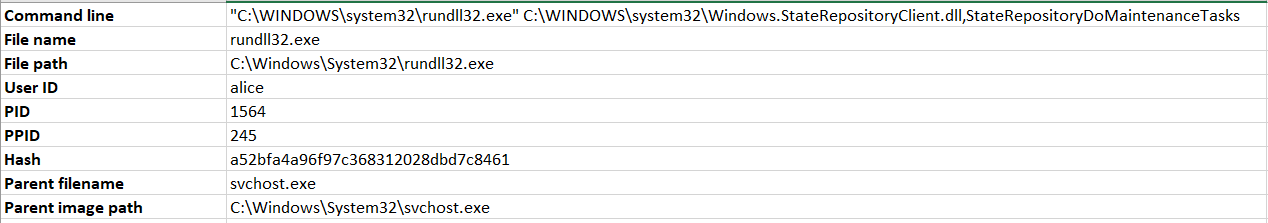
My first idea was to search for new LOLbins or GTFObins. If we, for example, want to find alternatives to rundll32.exe, we could search for executables that take a path to a DLL file as a command line argument – assuming that at least some of those applications would be expecting a DLL file name with the intention of executing it.
So, the search conditions for our telemetry will be:
- event equals “process creation”
- command line contains “.”dll”
To no surprise, the first among many results we are likely to get is rundll32.exe itself:
After getting rid of rundll32.exe from results, we are very likely to then come across Microsoft CompatTelRunner, like below:
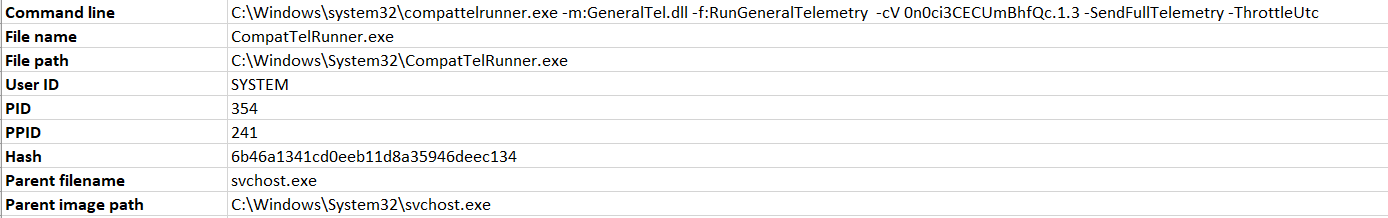
From this point, if we want to follow up on a result of our choosing – in this case by checking if we could use CompatTelRunner.exe the same way we would use rundll32.exe – we have the means to do so, as we already have:
- the full path to the executable,
- the command line it is normally run with,
- its control sum – in case we do not have the file in our own system, we can try to obtain it from somewhere else using the hash (for example from VirusTotal).
Once we have the executable, we can analyze it statically and test it dynamically – in this case we want to check if CompatTelRunner.exe would run LoadLibrary() on an arbitrary DLL file provided through the “-m:” switch in its command line. The follow up process is beyond the scope of this article. For CompatTelRunner.exe, it turned out not to be a viable alternative to rundll32.exe, for a number of reasons (e.g. it expects to be run as SYSTEM, it does not accept DLLs outside of its own whitelist etc.).
The point being – this simple search query made us learn that such executable exists, and its command line arguments suggest it could do the same thing as rundll32.exe. Demonstrating, that by studying EDR telemetry we can learn about potential LOLbins and then manually confirm or rule out whether they are useful.
By the way, proxy execution with DLL paths provided as command line arguments is not very practical from the offensive standpoint – there are stealthier ways to attain loading of arbitrary DLLs into executables natively existing in the system, like using environmental variables (https://hackingiscool.pl/a-case-of-dll-side-loading-from-unc-via-windows-environmental-variable/, https://www.youtube.com/watch?v=LxjnI5h_kls&ab_channel=DEFCONConference) or hijacking the default DLL search order (https://hijacklibs.net/).
Discovering executables taking DLL files as arguments is just one example of command line-based search. We could as well search for:
- programs taking URLs/specific protocol handlers as arguments – for instance to try to discover an alternative to wget/certutil (Living off The Land) or to look for targets related to a specific protocol (vulnerability research),
- programs processing a particular file format, e.g. docx, png, js or html (vulnerability research),
- programs taking arguments matching specific patterns, like UNC paths, passwords, or other secrets.
Learning how to run unknown executables
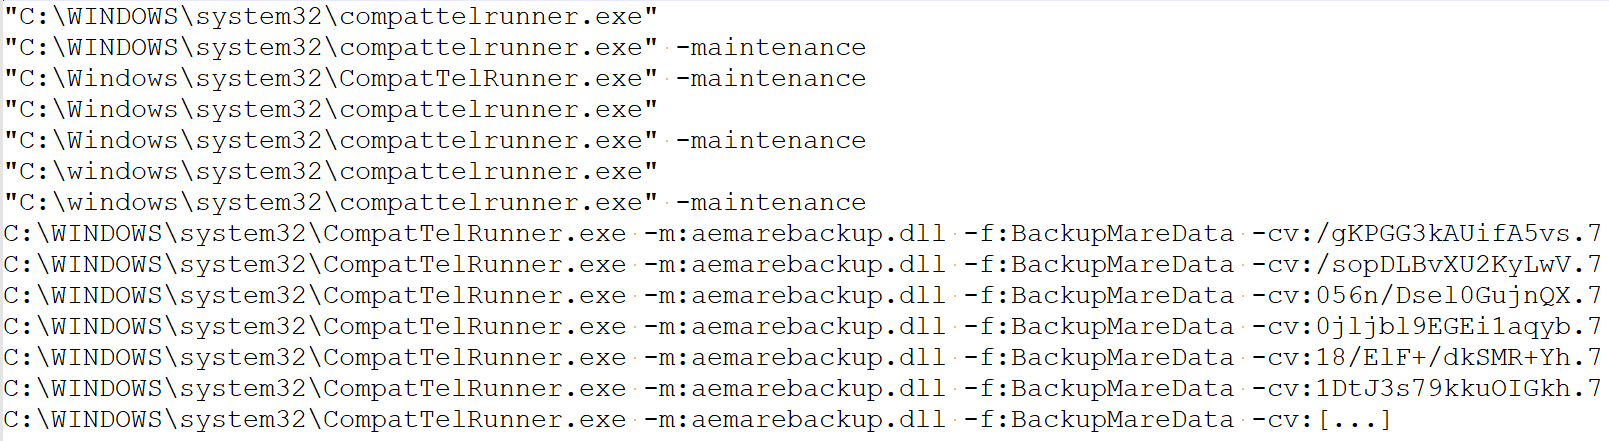
Another scenario is searching for all instances of process creation based on the file name attribute alone, just to see all the command lines naturally occurring for it in the environment. Especially while studying undocumented executables or aiding our static analysis efforts, whereas we could simply find out how a particular executable is run, so we could jump right into dynamic analysis. It is much faster to find examples of correct invocations of such an executable instead of having to figure out all the parameters it expects along with their valid values by performing manual static and dynamic analysis. For example, the full list of unique command lines for CompatTelRunner.exe pulled out from EDR:
LPE (Local Privilege Escalation)
The first thing we think about when talking about offensive research are security vulnerabilities. As it turns out, properly searching through EDR telemetry can quite effectively help reveal some.
Process creation (again)
The most basic, easy to understand and the easiest to find LPE vector is when one user executes code from a file owned by another user. In other words, the process owner is different from the owner of the executable. In all EDRs the process creation event includes the identity of the process owner. On the other hand, the information on the executable file is very scarce in telemetries of most vendors (usually just the full path and the hash), and it does not include file ownership information or its filesystem permissions (chmod/ACL). If your EDR provides this information in its telemetry, you are lucky.
Still, we can quite accurately assume file ownership based on the location and run few interesting searches that should work on any EDR.
So, let’s search for processes:
- event is process creation,
- created with high privileges (SYSTEM/root),
- spawned from executables located in user-owned directories (starting with C:Users or /home).
Depending on the environment we query, we should get no or few results, as we are searching for something abnormal. Still, the larger the environment, the more results.
So, among the results, I found a couple of executables running as SYSTEM (SID S-1-5-18) from locations like:
- “java.exe” -classpath “C:UsersuserDownloadsapache-maven-3.8.7-binapache-maven-3.8.7bootplexus-classworlds-2.6.0.jar” “-Dclassworlds.conf=C:UsersuserDownloadsapache-maven-3.8.7-binapache-maven-3.8.7binm2.conf” “-Dmaven.home=C:UsersuserDownloadsapache-maven-3.8.7-binapache-maven-3.8.7” “-Dlibrary.jansi.path=C:UsersuserDownloadsapache-maven-3.8.7-binapache-maven-3.8.7libjansi-native” “-Dmaven.multiModuleProjectDirectory=C:ProgramDataJenkins.jenkinsworkspaceMVN” codehaus.plexus.classworlds.launcher.Launcher clean com.fortify.sca.plugins.maven:sca-maven-plugin:22.2.0:clean package com.fortify.sca.plugins.maven:sca-maven-plugin:22.2.0:translate.
- C:UsersPublicDocumentsBGInfoBGInfo.exe.
As follow up investigation revealed, in the first case we had an interactive user with local admin privileges downloading Apache Maven and running it as a service from the same directory. This is not a vulnerability, however it arguably creates some additional risk – as I already explained in one of my previous blog posts.
The second case – C:UsersPublicDocumentsBGInfoBGInfo.exe – was much different. It was another case of a local service, however deployed in C:UsersPublicDocumentsBGInfoBGInfo.exe in a shared environment. Unless the permissions on the BGInfo directory were explicitly changed by the owner right after deployment, we are dealing with a local privilege escalation. The issue with C:UsersPublic is that by default everyone can create directories and files in there, and by default every object created there inherits those permissions – which means that if we put an executable file there, then by default other users can overwrite it, smuggling their own code into it. A scenario I covered a bit deeper in another blog post (https://atos.net/en/lp/securitydive/public-to-public-credential-access).
So, we have our first vulnerability discovered with EDR! Not a software issue, but rather a local deployment mistake made by an administrator.
For Linux we can expect similar results. Several cases of daemons/scripts running as root but deployed in individual /home/ directories of local users – creating limited local privilege escalation vectors, whereas those particular users could smuggle their code into a root-owned processes. Your infrastructure will give you different results.
Some example results we discovered and investigated internally:
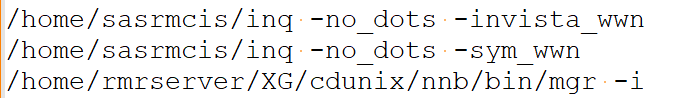
Your results will be different; every infrastructure is unique.
So, we have already come up with search queries that can help us discover file-based LPE issues created by users and administrators. That’s a start. But what about vulnerabilities in commonly used software, 0days?
DLL loading
While hunting for Local Privilege Escalation based on execution of code from files owned by different security identity than the one executing the process, one must not forget about DLLs!
Unfortunately, some EDRs do not collect DLL load events as a part of their searchable telemetry, so this scenario is not viable for you if your solution does not support it.
Here are our search conditions:
- event is DLL loading,
- file path (of the DLL) contains “users”,
- process running as SYSTEM.
One of the results that caught my attention as a potential LPE vulnerability was Unity Parsec Desktop App:
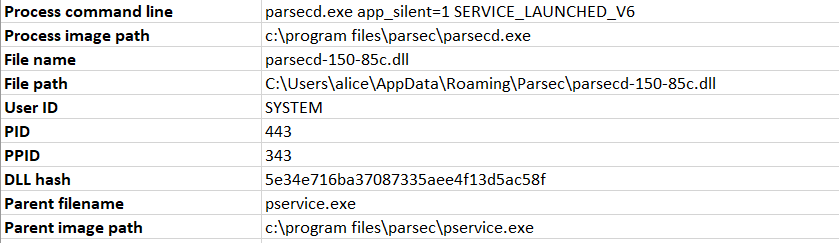
What we have here is C:program filesparsecparsecd.exe running as SYSTEM, loading a DLL named parsecd-150-85c.dll from regular user’s %APPDATA%Parsec directory.
Another interesting result was Pulse Secure with its Pulse Setup Client:
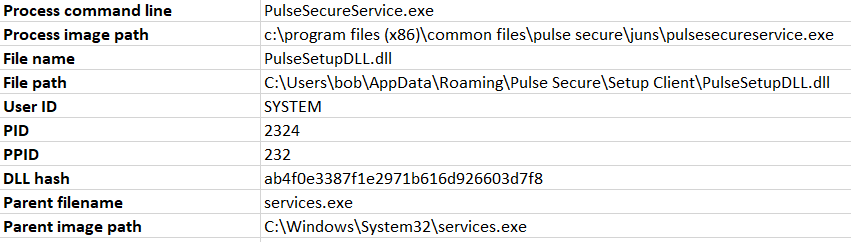
After manual follow-up investigations both turned out to be valid, previously unknown Local Privilege Escalation issues resulting from DLL hijacking (Unity Parsec – CVE-2023-37250 and Ivanti Pulse Secure Connect Client – CVE-2023-38041, respectively). Both applications verified digital signatures of the DLL files controlled by the regular user, and in both cases, that process was prone to a TOCTOU (Time of Check versus Time of Use) race condition.
Follow-up process
Keep in mind – our EDR search results alone do not prove vulnerabilities, they just indicate behaviors that may be exploitable. Every single case is different and sometimes there is a long way from simply detecting that in some systems under some (unknown to us) conditions a highly privileged process loaded a DLL file from a user-owned directory.
If we want to prove exploitability, we need Proof of Concept. In this case we want to trick the highly privileged process to load our own DLL file, so our test code located in DllMain executes as a part of that process, with SYSTEM privileges.
Before we begin, we need a DLL file to test. We also have to create a lab environment similar to the original system where EDR sensor observed our event of interest. As a prerequisite, we need to run a matching operating system and architecture, obviously obtain the software (might be difficult), install it if required, set it up.
Then, there are two more steps we must take:
- We must be able to trigger the event (DLL loading) in the privileged process. If the event happens naturally without our interaction, we need to know when to expect it and wait for it – which is bad for both exploit development process and exploitation itself. In Parsec, the event occurred whenever the regular user started the client – so it was extremely easy to reproduce and trigger indefinitely. Being able to trigger the DLL load operation was sufficient to start developing an exploit. In Ivanti Pulse Secure Connect Client, discovering how to reach the code responsible for starting the dangerous DLL load took me a significant amount of time and effort – and was the most difficult part of the entire process, because we are dealing with closed-source products and undocumented features. The proof in EDR that some event took place does not tell us how it was triggered. And discovering that condition with the intention of recreating it might turn out very tricky. In addition to static and dynamic analysis, reading documentation and interviewing users, other telemetry data might give us some hints as well.
- We must execute our own arbitrary code from the process by replacing the legitimate DLL with our own. While most applications in this scenario do perform digital signature verification, many are implemented vulnerable to TOCTOU race conditions. To execute our code, we need to win the race condition. The application might not be vulnerable to this, so until we prove otherwise, we are only talking about a potential vulnerability. A detailed description of such exploit can be found in my previous article.
So, the entire follow-up process of getting from an interesting EDR search result to a working LPE Proof of Concept can be quite demanding as that is where the real work starts. As a separate subject, it is beyond the scope of this article.
LPE – msiexec repair mode
Some race conditions involving highly privileged processes interacting with regular users occur in msiexec repair scripts of MSI packages. The subject is very-well explained in this article from Mandiant. If a software product is distributed as an msiexec installer (MSI), if the installer package supports repair mode, it is possible for regular users (without admin privileges) to trigger those scripts and in result trigger dangerous interaction (like a race condition involving an executable file or freezing the conhost.exe window with a click to then escape to browser running as SYSTEM).
We can make a safe guess that if some operation is performed during installation (installer script in the MSI package), it will also be executed in repair mode.
For potential DLL hijack conditions in installers, our search condition could be:
- event is DLL loading,
- file path (of the DLL) contains “users”,
- parent filename equals “msiexec.exe”,
- process running as SYSTEM.
And for process creation events from user-owned directories (potential exe hijacks):
- event is process creation,
- File path contains “users”,
- parent filename equals “msiexec.exe”,
- process running as SYSTEM.
These searches helped me discover and confirm several LPEs in repair mode (still being addressed as of writing this), including one affecting another major product of another major vendor.
Some other results turned out to be vulnerable versions of products already having relevant CVEs and fixes released. We simply encountered systems still running vulnerable versions of those products.
Potential conhost.exe hijacks
File-based LPEs are not the only viable attack vector against msiexec repair mode scripts. Some installers can be exploited by clicking on the conhost.exe window spawned automatically for every child process using the console subsystem (a console application). Then, since the conhost.exe process is running as SYSTEM, an escape to web browser, and usually from there to explorer and cmd.exe, is performed to run arbitrary code. This technique is also described in the article from Mandiant.
If we want to search for installers potentially vulnerable to this, we want to run a search for conhost.exe instances created from msiexec.exe:
- event is process creation,
- file name equals “conhost.exe”,
- parent filename equals “msiexec.exe”,
- process running as SYSTEM.
Now again, we must remember that the results we obtain are not enough to deem something vulnerable. The fact that conhost.exe was run, alone does not mean the installer is vulnerable. Our EDR telemetry will not provide us with the information on whether the conhost.exe process was run with its window visible – as that is the condition for the regular user to be able to click on the window when it pops up during installation process. Moreover, this search does not tell us whether the relevant MSI package even supports the repair more. We could hunt for process creation events with command line containing “msiexec.exe /fa”, but that makes more sense for threat hunters looking for indicators of exploitation of msiexec.exe repair mode issues, as a universal rule. This is not a well-known feature and barely anyone uses it – there won’t be many/any results in EDR telemetry. Instead, we are searching for any conhost.exe instances simply having “msiexec.exe” as their parent process and making a safe assumption that the relevant installer supports repair mode and that the repair script performs the same actions as the regular installer mode does, including the one we want to attack.
LPE from another angle – file creation
When it comes to file based LPE issues, process creation and image loading are not the only potentially helpful events typical EDR telemetry provides. Most EDRs detect and collect the event of file creation, especially when it is an executable. We can detect deployment of executable files into dangerous locations such as C:UsersPublic.
Unfortunately, this is the only useful application of typical file creation events I found.
It’s because we are only reaching instances when permissions on executables can be assumed based on the directory ownership assumption, based on the parent directory being C:Users. What we are really interested in are the filesystem access permissions of the newly created executable (ACL in Windows, chmod in Linux). Based on that information we could discover way more cases.
If your EDR telemetry provides this information, you are lucky.
More vulnerabilities, more base events
As I said earlier, the number of possible search scenarios is limited by our creativity and the telemetry our EDR provides. Other interesting scenarios we might find, or at least narrow down, could be, for example:
- arbitrary directory delete LPEs,
- LPEs from leaking handles from privileged processes,
- potential command injection points in web applications by monitoring child processes of webserver processes,
- potential domain name hijacks based on unresolved DNS queries,
- any other event specific to some unique base event or property our EDR provides us,
and anything else we might come up with.
Since vendors can and often do change their telemetry quietly, usually by enriching it with new base events and properties, the searching capabilities we have at hand might expand anytime.
EDR vs Procmon
If you’re familiar with monitoring and debugging applications with Procmon, you probably already noticed similarity between that process and what I described in this article. There are, though, some fundamental differences.
Difference #1 – filter visibility and depth
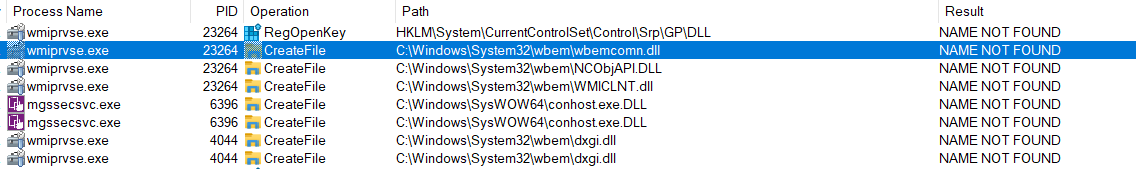
Sticking to DLL hijacking example, it is worth noticing that a significant number of LPE issues resulting from it occurs via DLL search order hijacking or simply under the condition that some DLL file is found in some arbitrary location, while its absence is silently ignored. They manifest in Procmon output just like examples below:
The event filter to catch those events could look like this: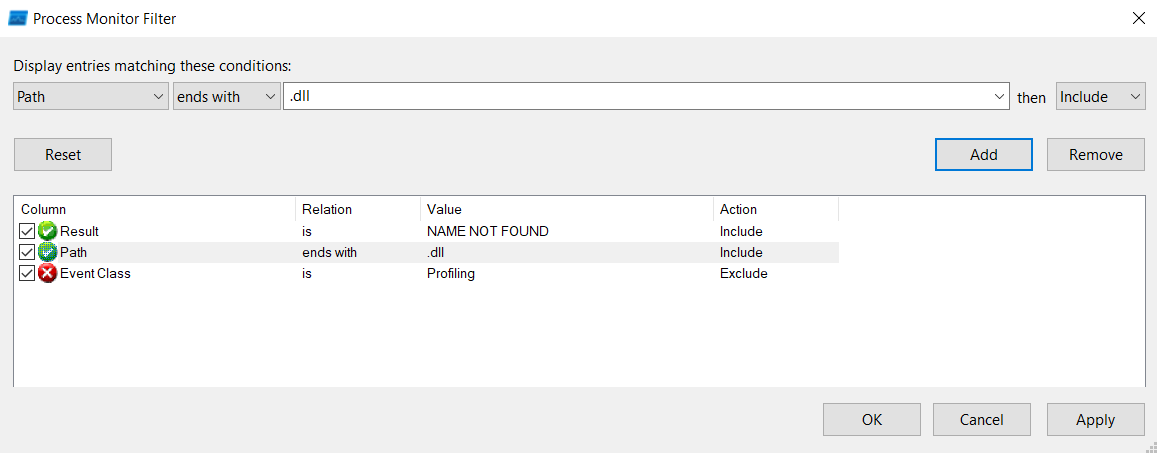
EDR telemetry, however, only contains successful image load events, which means it will not give us information on failed attempts of loading nonexistent DLL files. Which is a huge disadvantage as compared to what Procmon gives us. Procmon captures a lot more data than an average EDR sensor. This is both in terms of the total number of supported base events and the level of detail they contain. This is mostly because EDRs, while collecting that data from large numbers of endpoints, must account for the scale (the data must be uploaded, processed, stored and be accessible).
Difference #2 – scale
The main advantage of EDR telemetry, however, is the scale at which event information is collected. This applies both to the total number of endpoints, but also to the completeness of data for each one of them – since EDR sensors are running all the time. Procmon is a GUI application we only run for a while to catch operations we are expecting to occur immediately – for example because we know how to trigger them.
Thus, the scale makes EDR telemetry great for learning about software behaviors because it combines:
- the full set of all unique executables and libraries running across many systems,
- the full set of all unique observed behavior patterns (like accepted command lines and DLL loads) from many systems, helping to catch less commonly occurring events (for example the event of interest naturally occurring in only 5% of instances).
Could EDRs evolve in this direction?
Some EDR vendors to some extent provide additional vulnerability management intelligence for assets covered with EDR (sometimes delivered for extra cost), but those features only focus on known vulnerabilities. EDR evolving towards telemetry enriched with attributes helping discover potential software vulnerabilities would be an interesting development to see. For the same reason it would be interesting to be able run Procmon on scale – with remotely managed event filters.
Posted on: October 24, 2023

Julian Horoszkiewicz
Digital Security Portfolio Manager
Follow or contact Julian:
![]()
![]()
Share this article
![]()
![]()
![]()
![]()